Movielens Case Study

DESCRIPTION :
Background Problem Statement :The Group-Lens Research Project is a research group in the Department of Computer Science and Engineering at the University of Minnesota. Members of the Group-Lens Research Project are involved in many research projects related to the fields of information filtering, collaborative filtering, and recommender systems. The project is led by professors John Riedl and Joseph Konstan. The project began to explore automated collaborative filtering in 1992 but is most well known for its worldwide trial of an automated collaborative filtering system for Usenet news in 1996. Since then the project has expanded its scope to research overall information by filtering solutions, integrating into content-based methods, as well as, improving current collaborative filtering technology.
Problem Objective :Here, we ask you to perform the analysis using the Exploratory Data Analysis technique. You need to find features affecting the ratings of any particular movie and build a model to predict the movie ratings.
Domain: Entertainment
Analysis Tasks to be performed steps : Import the three datasets
- Create a new dataset [Master_Data] with the following columns MovieID Title UserID Age Gender Occupation Rating. (Hint: (i) Merge two tables at a time. (ii) Merge the tables using two primary keys MovieID & UserId)
- Explore the datasets using visual representations (graphs or tables), also include your comments on the following:
- User Age Distribution
- User rating of the movie “Toy Story”
- Top 25 movies by viewership rating
- Find the ratings for all the movies reviewed by for a particular user of user id = 2696
Feature Engineering : Use column genres:
- Find out all the unique genres (Hint: split the data in column genre making a list and then process the data to find out only the unique categories of genres)
- Create a separate column for each genre category with a one-hot encoding ( 1 and 0) whether or not the movie belongs to that genre.
- Determine the features affecting the ratings of any particular movie.
- Develop an appropriate model to predict the movie ratings
Step 1 import libraries :
import numpy as np
import pandas as pd
import matplotlib.pyplot as plt
from matplotlib.style import use
%matplotlib inline
import seaborn as sns
import warnings
warnings.filterwarnings(‘ignore’)
Load the data set :
ratings = pd.read_csv(‘ratings.dat’, sep=’::’, header=None, names =[‘UserID’,’MovieID’,’Rating’,’Timestamp’])
users = pd.read_csv(‘users.dat’, sep=’::’, header=None, names =[‘UserID’,’Gender’,’Age’,’Occupation’,’Zip-code’])
movies = pd.read_csv(‘movies.dat’, sep=’::’, header=None, names =[‘MovieID’,’Title’,’Genres’])View the data-set :
ratings.head()
users.head()
movies.head()
users.info()
Merge all the datasets into one Master data-set:
master_data = pd.merge(movies, ratings, on = ‘MovieID’)
master_data = pd.merge(master_data, users, on = ‘UserID’)
master_data.head() #to view the data
Step 2 Visualize user age distribution:
users.plot(kind=’hist’, y=’Age’)
plt.show()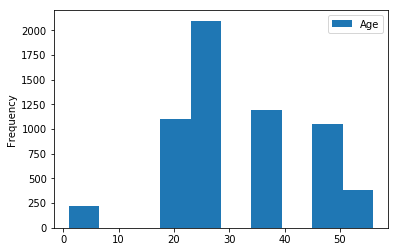
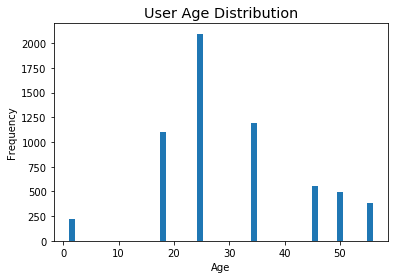
Visualize age distribution of users
users.Age.plot.hist(bins=50)
plt.style.use(‘ggplot’)
plt.title(‘User Age Distribution’)
plt.xlabel(‘Age’)
plt.show()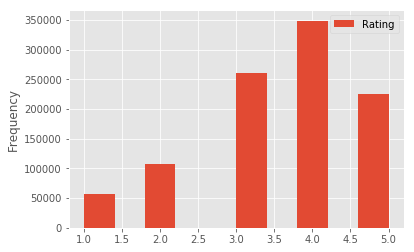
Visualize overall rating by users
ratings.plot(kind=’hist’, y=’Rating’)
plt.show()
Find and visualize the user rating of the movie “Toy Story”
ToyStory = ratings[ratings[“MovieID”] == 1]
ToyStory.head(10)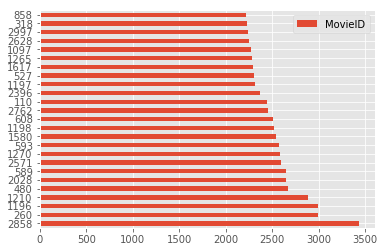
Find and visualize the top 25 movies by viewership rating
merge2 = pd.merge(movies, ratings, on = ‘MovieID’)
merge2.head()
Top25 = merge2[“MovieID”].value_counts().head(25)
Top25 = pd.DataFrame(Top25, columns=[‘MovieID’])
Top25.plot(kind=’barh’)
top=merge2[“Title”].value_counts().head(25)
Top = pd.DataFrame(Top, columns=[‘Title’])
Top.plot(kind=’barh’)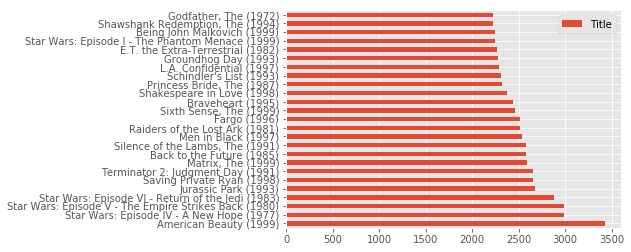
Genre category with a one-hot encoding :
unique_genres=pd.Series(unique_genres)
unique_genresmovies.Genres = movies.Genres.str.split(“|”)
movies.Genres[:3]df = pd.DataFrame()
for row in movies.Genres:
 a= unique_genres.isin(row)
 df= df.append(a,ignore_index=True)
df[:5]df.columns=unique_genres
df.head()
movies = pd.concat((movies ,df),axis=1)
movies.head()
Feature Engineering : Find out all the unique genres Find the rating for a particular user of user id = 2696 :
merge3 = pd.merge(ratings, users, on = 'UserID')
User_2696 = merge3[merge3["UserID"] == 2696]
User_2696
movies.Genres.head()
genres = []
for i in movies["Genres"]:
 temp=i.split("|")
 genres.extend(temp)
unique_genres=list(set(genres))
print(unique_genres)
print(len(unique_genres))
Features affecting the ratings of any particular movie :
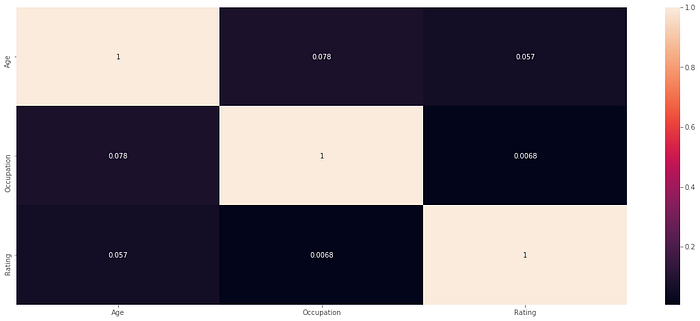
features = merge3.drop([‘UserID’,’MovieID’,’Timestamp’,’Zip-code’], axis=1)
features = features[[‘Age’, ‘Occupation’, ‘Rating’]]
features.head()
plt.figure(figsize=(20,8))
corr=features.corr()
sns.heatmap(corr,xticklabels=corr.columns.values,yticklabels=corr.columns.values,annot=True)